



I am constantly asked by subscribers which financial data platforms I recommend.
There is no perfect answer. It really depends on your needs, and of course your budget.
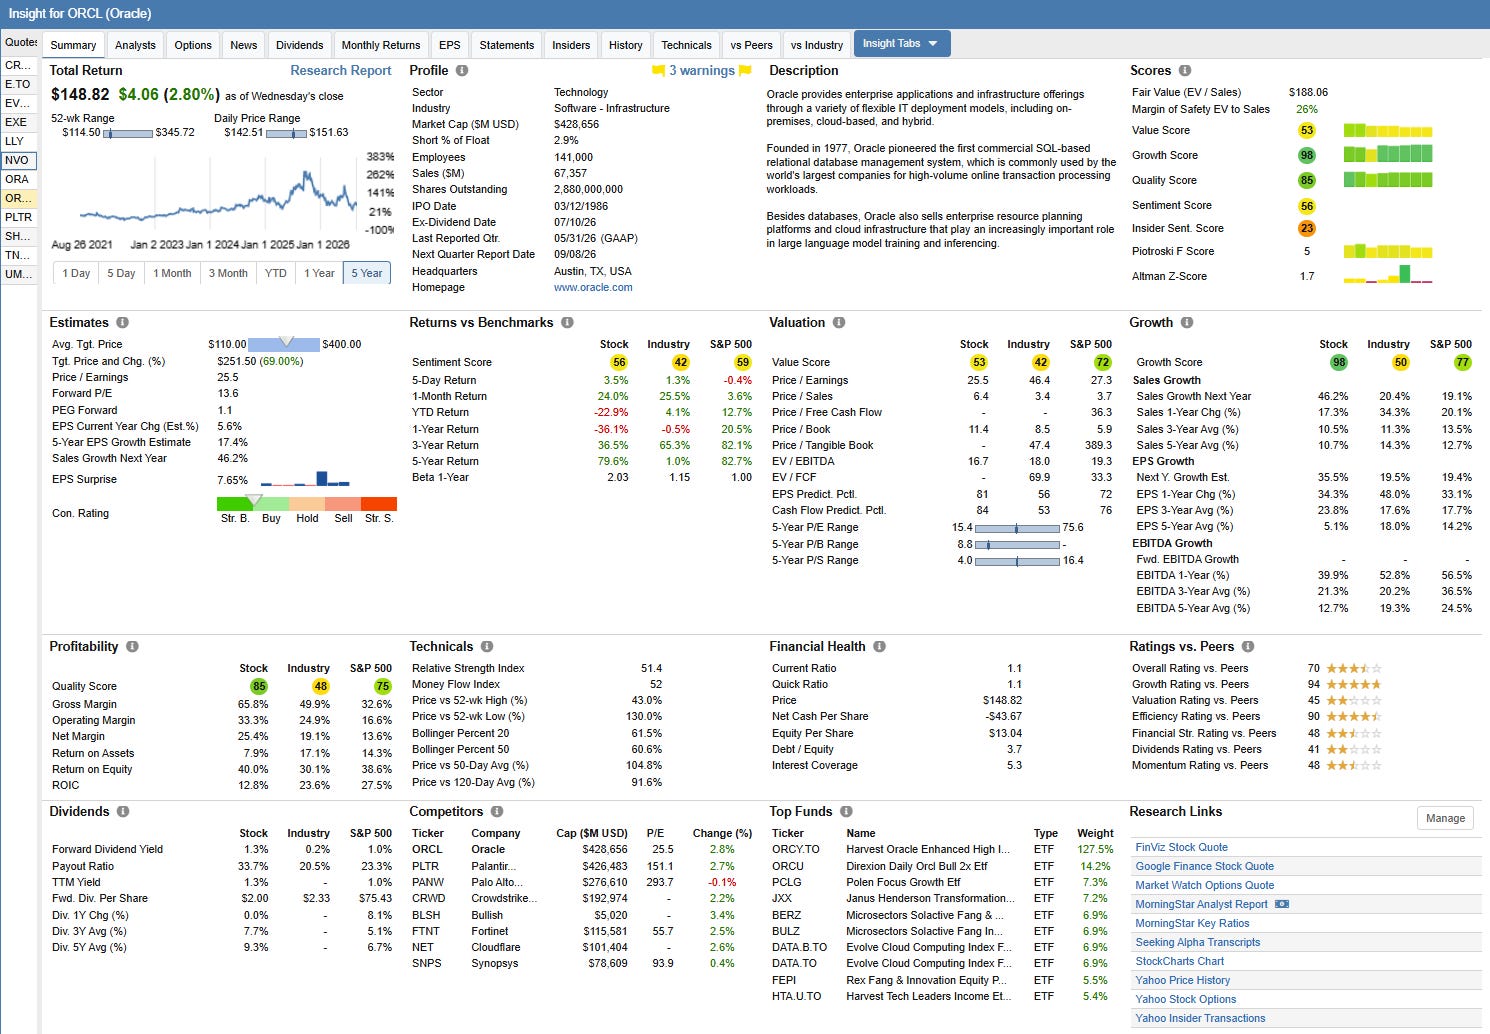
However, after a review of the market, I discovered that for non-institutional investors focused on long-term stock selection, value investing, dividend analysis, or fundamental portfolio management, Stock Rover provides a wonderful value proposition on a price-to-quality measure.
It’s not a Bloomberg terminal, but pricing starts at only $29/month billed annually and it delivers almost everything most investors could want from a data platform. In fact, it offers so much more than other budget platforms, so it punches well above its weight.
I have to be honest, I’d never heard of Stock Rover before doing this research, but I signed up for a free trial and have been using it for the past week.
I was so impressed, so I wanted to share my experience.
The layout and navigation is intuitive, with tabs at the top of the page and menus elsewhere.
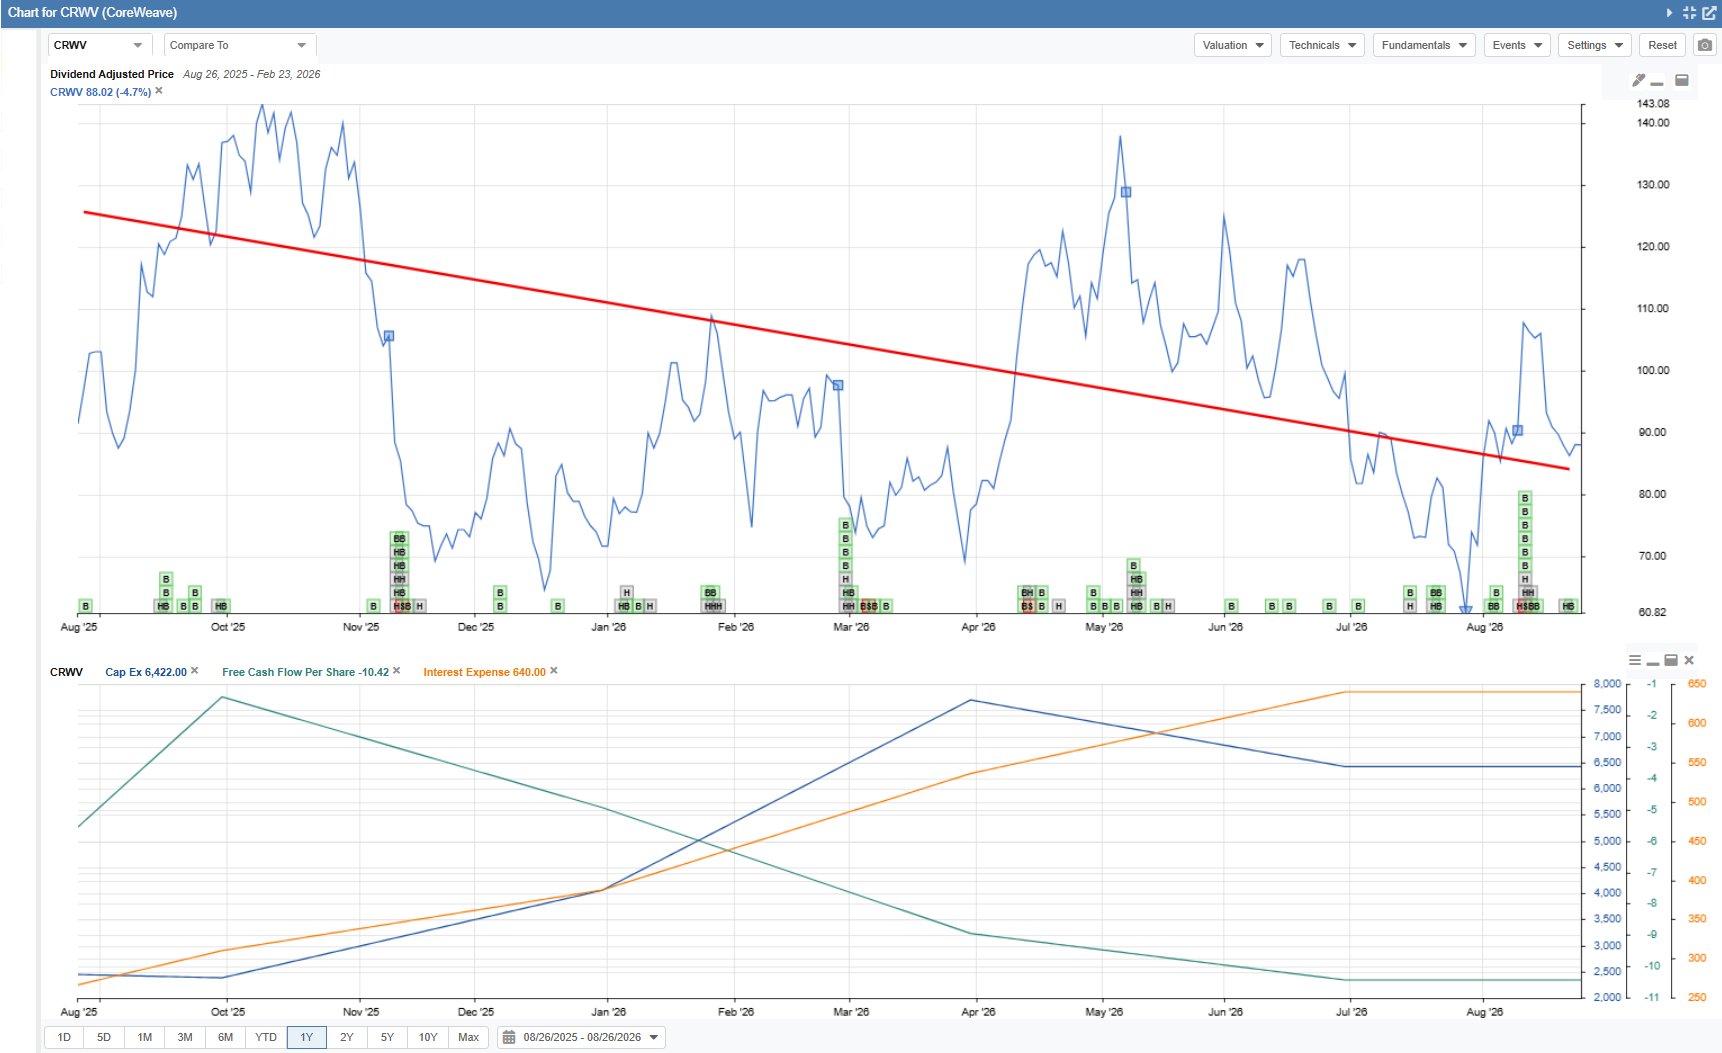
I liked the charting capability which allows the plotting of the market price directly against fundamental metrics like EPS, Sales, or Free Cash Flow over a 10-year period. It provded me with an instant visual check on whether a stock's price is backed by improving unit economics, or if it was only being driven by momentum and market sentiment.
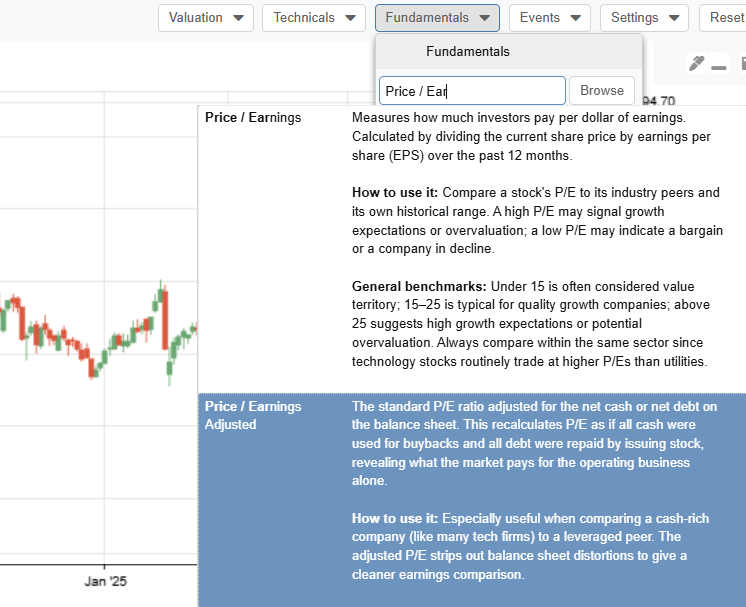
The platform is very configurable and the choice of metrics is truly impressive for a budget platform. In addition to the standard ratios used everywhere else, Stock Rover offers adjusted versions with a full explanation of how they are calculated and the benefits of using them.
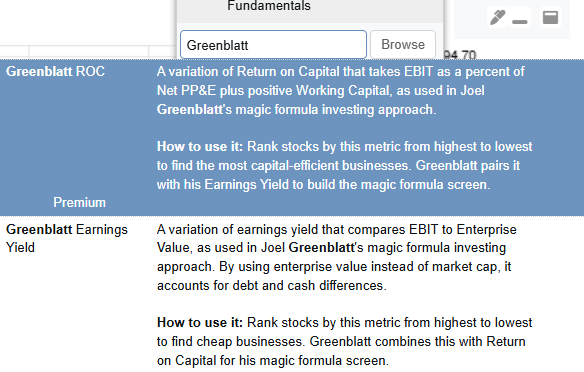
And if you’re a fan of custom metrics used by the legendary investors, it offers those too.
It also has a neat ‘Investor Warnings’ feature which automatically scans for subtle red flags, like dangerous goodwill levels or earnings deceleration. This kind of feature is valuable and I haven’t seen it on any other low cost data platfrom until now.
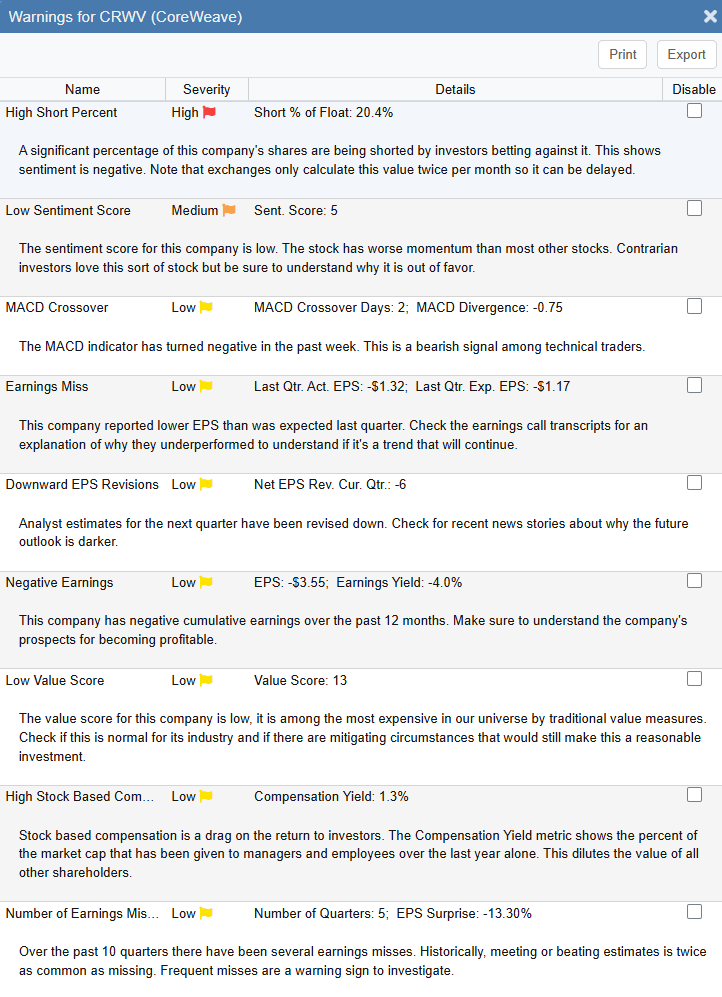
It has extensive analytical functionality, plus screeners for fundamental value and dividend investors. Better still, it allows operations like screening based on custom formulas, multi-year CAGR metrics, or fundamental equations that most other low cost platforms restrict.
In addition it offers portfolio health and tracking by connecting directly to brokerage accounts via Yodlee to run Monte Carlo simulations, dividend income forecasting, and correlation matrices on your actual portfolio holdings.
It isn’t perfect. There are limitations: primarily its lack of international stock exchange data outside North America. However, for those investing in the United States and Canada it’s an incredibly powerful tool and will be hard to beat at this price point.
Below is a comparison of most of the leading data platfroms I looked at, sorted by price (high to low).
Platform Comparison
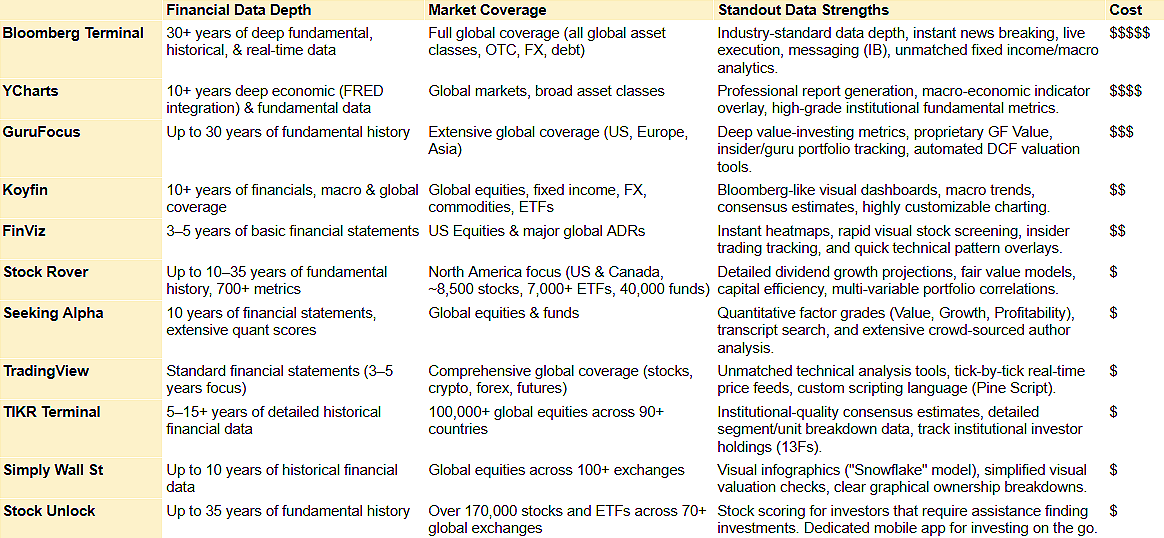
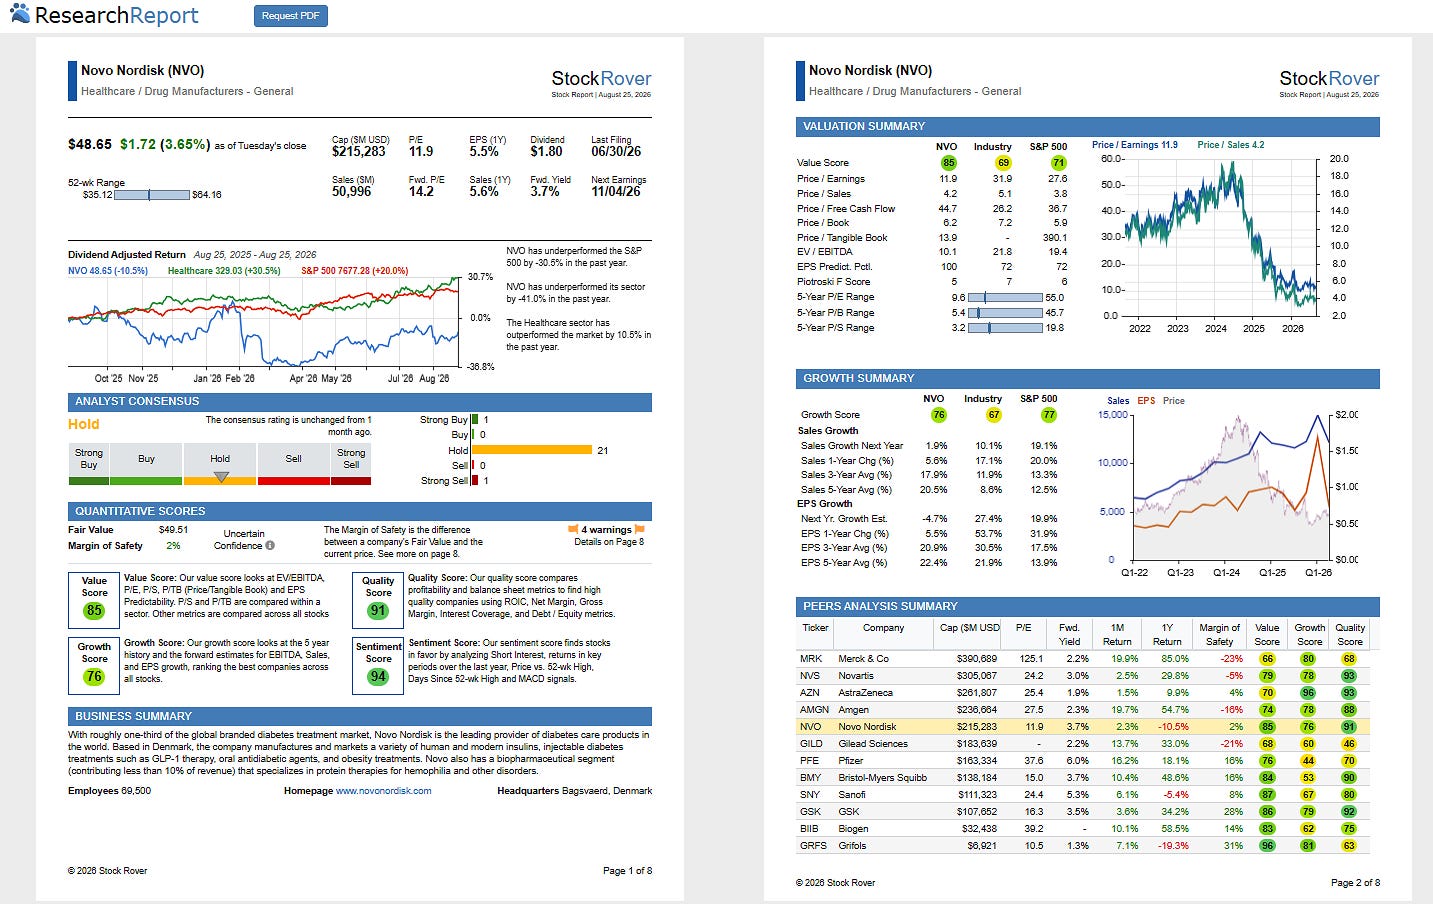
As you will see, Stock Rover offers functionality that is typically reserved for platforms at a higher price point, yet is makes it all available at a low cost. It even generates extensive 8 page professional research reports that can be printed out:
Nonetheless, it may not be suited to everyone. I’ll call out where the platform would not be suited for you.
If you trade globally or require real-time technical charting choose TradingView or Koyfin. Stock Rover’s interface focuses on data quantity and quality rather than fluid charting software, and it only covers North American securities.
If you want crowd-sourced stock pitches & earnings transcripts choose Seeking Alpha or Value Investors Club. Stock Rover focuses heavily on raw data, ratios, and quantitative screening rather than commentary, qualitative research or user-generated theses.
If you need an intuitive mobile experience competitors like Stock Unlock or Koyfin offer cleaner mobile applications. Stock Rover is optimized for desktop browsers.
Conclusion
Stock Rover is super impressive, but it won’t be for everyone. The best you can do is try it for yourself.
The great news is that they offer a free 14 day trial without the need to provide any payment details.
Click on this link or the image below if you are interested in the free trial.

Disclosure: The views and analysis in this product review are entirely my own. However, I have spoken with Stock Rover ahead of publishing this post. If you choose to sign up using my link, Stock Rover has agreed to say ‘thank you’ by providing some financial support to the Rock and Turner Substack at no additional cost to you.

thanks, James! StockRover does look very impressive, for a very low cost. Unfortunately, the NA only coverage makes it not useful for me. I’m using Stockopedia, which has a lot of the Stock Rover functionality + adds some neat little things of its own. The cost is also low and you can adjust it by selecting the full data coverage only for the global regions you need. Maybe of interest as well?