


Why Is UK's ARM Holdings Listing In The U.S.?
Why Is UK's ARM Holdings Listing In The U.S.?
A Higher Valuation? No Chance! And Here's Why

 rather than the U.K. Stock Exchange")
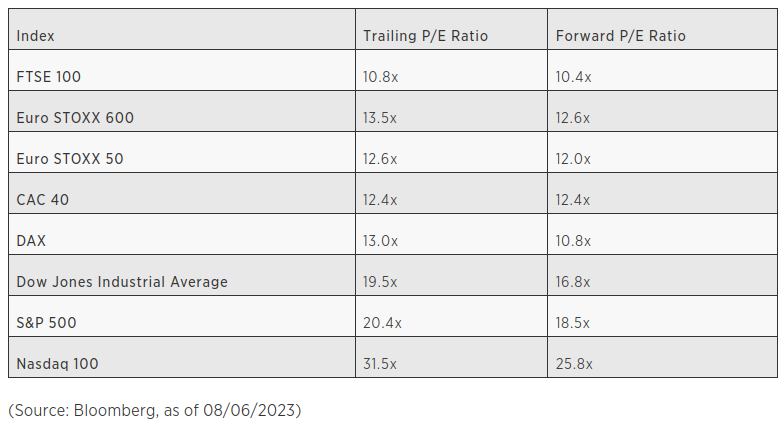
The table below demonstrates the stark contrast in valuation multiples achieved by U.S. listed companies relative to their European counterparts.
The logical conclusion, therefore, would be that a higher multiple of the same earnings results in a higher valuation. This is clearly what has motivated Cambridge based ARM’s owner, Softbank, to I.P.O. the company in the U.S. rather than on ARM’s home U.K. stock market?
It isn’t uncommon for executives to speculate that the discrepancy arises from investors being more inclined to pay premium prices for shares of U.S. listed companies.
This assumption has prompted many non-U.S. companies to list their stock on the New York Stock Exchange, aiming to enhance the valuation and the capital raised from the public float.
But this is flawed thinking and even sophisticated institutional investors such as Softbank seem to have missed the point. The market doesn't determine the valuation of individual companies... individual companies determine the average valuation of the market.
It is all about capital productivity or how the assets of the business are put to work. The higher valuation multiples of U.S. companies is entirely due to the tendency of US companies to generate superior Returns on Invested Capital (ROIC).
Capital productivity is the key to corporate success because the more return that a business is able to generate on incremental capital, the less capital it needs to grow.
Allow me to demonstrate with reference to See’s Candy, a Berkshire Hathaway company. In 1972, Warren Buffett bought See’s Candy for $25 million. At the time it had about $8 million of net tangible assets (including working capital). This level of tangible assets was adequate to conduct the business without the use of debt, and See’s was earning about $2 million after tax at the time. So Buffett paid $17 million over net tangible assets for See’s Candy, meaning that is was capitalized at 12.5x its earnings.
Now let’s imagine a hypothetical rival company called Saw’s Candy, that was also generating $2 million of earnings but on $16 million in net tangible assets. This company has growth prospects that are not as favourable as See’s Candy because to double its earnings it would need to raise $16 million of new capital. See’s Candy would only need an additional $8 million.
Said differently, if both companies raised an additional $16 million in capital, See’s Candy could triple its earnings, while Saw’s Candy would only double its bottom line. Accordingly, given the choice, where would you rather invest your money? The answer is clear. See’s Candy is the better investment opportunity which is why it will trade in the market at a premium to Saw’s Candy. In other words, the market price brings both opportunities back into equilibrium. So Saw’s Candy may only trade at the value of its net tangible assets, $16m - capitalized at 8x earnings.
So the ROIC of See’s Candy was 25% ($2m earnings on $8m capital) which justified a 12.5x P/E ratio, but for Saw’s Candy capital productivity was only 12.5% ($2m earnings on $16m capital) which resulted in an 8x P/E ratio. Both companies have the same earnings, but the earnings multiple is very different.
Hopefully I haven’t lost you. Stick with me as we are almost there. Let’s apply this back in the market at large.
In 2018, the median large-cap U.S. company achieved a 30% ROIC (excluding goodwill and intangibles), while their European counterparts were only achieving 19%. Just like in our example above, the huge divergence in capital productivity leads to a very different P/E ratio as demonstrated. This is born out in fact by the table at the start of this article.
The variance of these indices can be attributed in part to the differing industry composition. Notably, the U.S. possesses a more extensive presence of high-ROIC sectors, particularly technology. It is also down to cultural issues. McKinsey’s Corporate Performance and Analytics Tool (CPAT) examined a sample of more than 2,000 US and European companies with revenue of more than $1 billion. Between 2014 and 2019, large European companies were 20 percent less profitable (measured by ROIC), grew revenues 40 percent more slowly, invested 8 percent less (capital expenditure relative to the stock of invested capital), and spent 40 percent less on R&D than their US counterparts.
It's important to note that these broad comparisons overlook the fact that specific European companies, like sports car manufacturer Ferrari that generates 25% ROIC and trades on a P/E of 48, outshine many of their U.S. counterparts in terms of capital productivity (ROIC) and so they command premium valuations in line with the U.S. high performers.
ARM is just such a company. It produces high ROIC and will command a premium valuation wherever it is listed.
Additionally, ARM is a strategic company (more than 90% of our smart-phones contain ARM chips) and so big players in the space will want to take a sizeable stake in order to prevent the company from becoming the target of a hostile takeover. Apple, NVIDIA, Samsung and others are likely to invest. This is in addition to other investors, both retail and institutional, who will want or need (index trackers) to add this stock to their portfolio. None of these investors is geographically constrained, and so a London listing would have resulted in exactly the same valuation as a NASDAQ listing in New York.
In conclusion, as I said earlier and hopefully demonstrated, the market doesn't determine the valuation of individual companies... individual companies determine the average valuation of the market. So when high value companies such as ARM decide to list in New York rather than on their own domestic market (London in this case), it does nothing to redress the imbalance that currently exists between markets. Instead it just pushes the respective exchange average valuations further apart. That is a terrible shame.