


Industry Choices Matter | Choose Wisely
Some Sectors Perpetually Destroy Capital, While Others Create Wealth


Why Should I Care?
While most investors fixate on picking the next winning company, they often overlook a more crucial factor - choosing the right industry. The truth is, your odds of success may be determined less by the company you pick and more by the sector it operates in.
Consider air travel. No matter which airline you backed, the odds were stacked against you. On the other hand, in certain industries, you could have blindly thrown darts at a list of companies and still outperformed the S&P 500 year after year.
Now, let’s get to the data - because what it reveals is both surprising and game-changing.
Imagine industries as vast lakes, each teeming with different kinds of fish. Some lakes are full of fat, juicy salmon, while others contain little or nothing worth catching, a complete waste of time. Yet most investors make the mistake of fishing in the wrong lake simply because it’s the one they know the best.
“Go fishing where the fish are.”
Charlie Munger
People often stick to industries within their comfort zone, believing expertise alone guarantees success. But here’s what most miss: choosing an industry you know or like isn’t enough. What truly matters is investing in industries where returns consistently exceed the cost of capital.
And here’s the shocking truth - over decades of data, 71% of all publicly listed companies globally have failed this fundamental test. They don’t create value; they destroy it. That means the vast majority of investments are actually eroding wealth, not building it!
But here’s the fascinating part: some industries naturally breed winners, while others remain a graveyard for capital. Good industries tend to stay good. Bad industries rarely turn around. As the saying goes, a leopard never changes its spots.
By understanding this, you gain a powerful advantage - you can filter out weak investment opportunities at the industry level before even considering specific companies.
So, let’s dive in and uncover why this insight is a game-changer.
Thousands of Companies, Few Great Investments
This philosophy aligns with the insights of renowned fund manager Anthony Deden. In a compelling interview, Deden explained that while the universe of investable public companies is vast, the number of those opportunities that you would want in your portfolio is remarkably small.
Most investors use stock screeners to find potential winners. Deden, however, takes the opposite approach - he uses them to eliminate what he doesn’t want. Strip away the weak candidates, and you’ll be shocked at how few remain.
His approach goes deeper. Rather than blindly following data and price trends, he insists on becoming an expert in the industries that matter - those that create capital.
Deden warns against the common mindset of buying shares simply to flip them for a quick profit. If you’re relying solely on superficial metrics like price and earnings multiples, you have little incentive to truly grasp the intricacies of any business or industry. By contrast, a smart investor thinks like an owner - investing as if they were acquiring the entire company for the long haul.
Here’s a short two-minute video clip where Deden explains it himself.
The full Deden video (>2 hours) is at the bottom of this post:

Empirical research backs this up. Back in November 2024, I published an article that sparked widespread discussion in the investment world. The topic? The elite 4% - the small fraction of public companies responsible for the vast majority of wealth creation. This research, conducted by Professor Bessembinder, stunned many investors. If you missed that article, here is a link:

Today, I’m taking that idea a step further. Instead of searching for winners, let’s flip the question: how do we identify the losers to avoid?
Let’s dive in and explore why this shift in perspective is so powerful.
Which Industries Are Best For Investors?
‘Invert, always invert’, was Charlie Munger’s mantra. So instead of asking which industries are best, the question becomes, ‘Are there industries that investors should avoid?’
Some very prominent figures in the investing world believe so.
Terry Smith, a veteran British investor, founder and manager of the Fundsmith Equity fund, has consistently emphasized the importance of investing in high-quality sectors while avoiding those that tend to destroy capital.

“The return characteristics of businesses persist. Good sectors and businesses remain good, while poor sectors and businesses tend to be persistently poor.”
Terry Smith
The data supports this view. A table1 prepared by McKinsey & Company reveals a striking consistency over both a single decade and four decades - certain sectors reliably generate high Returns on Invested Capital (ROIC), while others chronically underperform.

However, sector performance isn’t always so static. The chart above, ending in 2003, was chosen deliberately to illustrate how the landscape can change over time. Consider ‘Telecommunication Services,’ which ranked poorly in this dataset - this was before the rise of smartphones. Today, it would likely be positioned much higher in this hierarchy. So it becomes important to reassess the data from time to time.
The consumer staples sector, which Terry Smith has always favoured, is home to companies that make everyday essentials like food, beverages, and household goods which enjoy brand loyalty. It has long been considered a safe bet. Historically, these products would sell regardless of economic ups and downs, offering investors dependable revenue and earnings. That reliability, especially during recessions, has made the sector a cornerstone in many portfolios, yet new challenges are reshaping the sector.
Digital platforms and e-commerce have disrupted traditional supply chains, giving new, smaller, agile brands a chance to compete with legacy giants. Shoppers, squeezed by inflation, are increasingly choosing cheaper private-label products. At the same time, consumer tastes are leaning toward healthier, more sustainable options - another way for newcomers to break in to the market. Add in persistent cost pressures and intensifying competition from direct-to-consumer startups, and the sector’s once-unshakable dominance looks less certain. As one expert puts it: "Consumer staples used to control the distribution chain, but digitalization has changed the game - disruptors now have a real shot."
More generally, strong return characteristics persist because good businesses find ways to fend off the competition - what Warren Buffett calls ‘The Moat’ - strong brands, control of distribution, research and development, innovation, marketing and promotion, network effects, patents, high switching costs and more. Companies operating in these industries are far more durable and so earn a premium valuation.
Conversely, companies with poor returns typically suffer from an absence of a moat. These businesses face intense competition, lack pricing power, and operate in sectors where consumers can easily defer spending in a downturn - people don’t need to acquire a new car or travel by air when money is tight. Companies operating in these industries are saddled with these poor characteristics - just because they have a low earnings multiple and appear cheap, most of the time they have the valuation that they deserve.
It should also be noted that the numbers used by McKinsey are ROIC, but they take no account of the cost of that capital which is of critical importance. So, while useful, this McKinsey data table only paints half a picture (more on this shortly).
So let’s turn our attention to shareholder returns for each sector as a proxy for performance. Although sectors tend to go in and out of favour with investors based on cyclicality and other temporal factors, over a long enough period this ought to become mean reverting as share prices converge on the intrinsic value of the business. For this reason we’ll look at a 15 year period.
Sector Performance Over Time
The colorful chart below breaks down the annual performance of the S&P 500 sectors by shareholder returns2 with the best-performing sector for each year at the top. The far-right column, outlined in red, displays the average annualized return over the entire period.
A glance at this column reveals that information technology (19.8%) and consumer discretionary (16.2%) sectors have been the primary drivers of the S&P 500’s strong performance. The index itself, positioned third with a 13.9% annualized return, remains uncolored for easy reference.
For passive investors, an interesting takeaway is that the S&P 500 never appears in either the top or bottom three rows in any single year. This is expected - it’s an index average. Yet, in the long-term average column, it climbs into the top three due to the way the index is constructed3. Even more revealing is that, over the 15-year period, all but two sectors have underperformed the index.
At the bottom of the table, energy (6.2%) and materials (9.0%) have been the weakest performers, frequently ranking last. For long-term buy-and-hold investors, allocating capital to these sectors might seem unwise. However, for investors focused on short-term special situations - turnarounds, cyclical recoveries, and other tactical plays - these sectors may still hold appeal.
The eagle-eyed reader will have spotted that energy was the best-performing sector in three separate years, including an extraordinary 65.7% gain in 2022 - the highest annual return of any sector in the entire dataset - and this followed a 54.6% gain in the prior year. This exceptional performance was significantly influenced by the impact of the Russia-Ukraine war which lead to oil and natural gas price spikes. However, even with these two exceptional years, the average annualized return for the sector was still only 6.2%, ranking it the worst sector, and so without 2021 and 2022 its performance would have truly abysmal.
Making Profit is Simply Not Enough
Many businesses operate under the misconception that generating profits is sufficient, but this overlooks the cost of capital.
A fundamental issue is that CEOs are primarily focused on managing their respective companies. Even when capital allocation is executed effectively, they are unable to generate returns beyond what the company itself is capable of achieving.
To make matters worse, weaker management teams frequently succumb to external pressures to prioritize non-economic goals, such as ESG initiatives, which require capital allocation in a suboptimal manner that most companies simply cannot afford. This results in diminished returns, which, in many cases, are already underwhelming.
Returning our attention to Terry Smith, over his multi-decade investing career, he has observed that many businesses either blindly chase growth, suffer from mediocre management, or else operate in sectors with unfavorable unit economics - in all of these cases they burn through capital rather than create it.
Smith’s response is logical - avoid investing in these companies and industries. His investment strategy also focuses on avoiding cyclical industries and highly leveraged companies. He prioritizes businesses with consistently high returns on capital, regarding this as a key marker of quality.
By excluding unfavourable industries and sectors, Smith narrows down where he will fish for investment opportunities - this is why he has achieved consistent long-term market beating results for his fund. He looks for businesses operating in industries that can sustain returns that exceed their cost of capital and is baffled that so few other investors do this.
“Investing in high-quality sectors and avoiding capital-destructive ones leads to better long-term performance. Contrary to the mantra that every fund has to recite, past returns of companies are a good guide to future returns.”
Terry Smith
So let’s adopt Smith’s approach by taking this analysis to the next level - we need to look at net returns being generated above the cost of capital.
Fortunately for us, Professor Aswath Damodaran of New York University's Stern School of Business has conducted extensive research on this subject. His analysis covers a sample of 48,000 publicly traded companies across various sectors, comparing Return on Capital (ROC) with the Weighted Average Cost of Capital (WACC) as a measure of value creation.
A table, compiled at the beginning of 2025 using U.S. public company data4 from the prior financial year, provides insights into these comparisons.
Some industries are cyclical while others, such as drug development, operate in multi-year development phases, so measuring their performance on an annual basis is inherently unreliable. However, overall, this analysis paints an informative picture. [Note: the Financial industry has been removed because their business model is so fundamentally different that it is impossible to compare them on this basis].

Less than 10% net return:
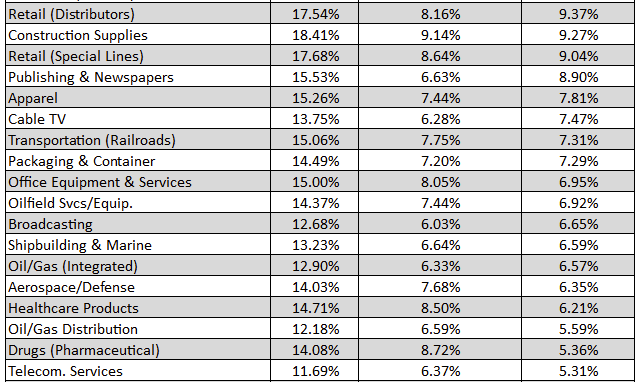
Low single digit net returns or net losses:
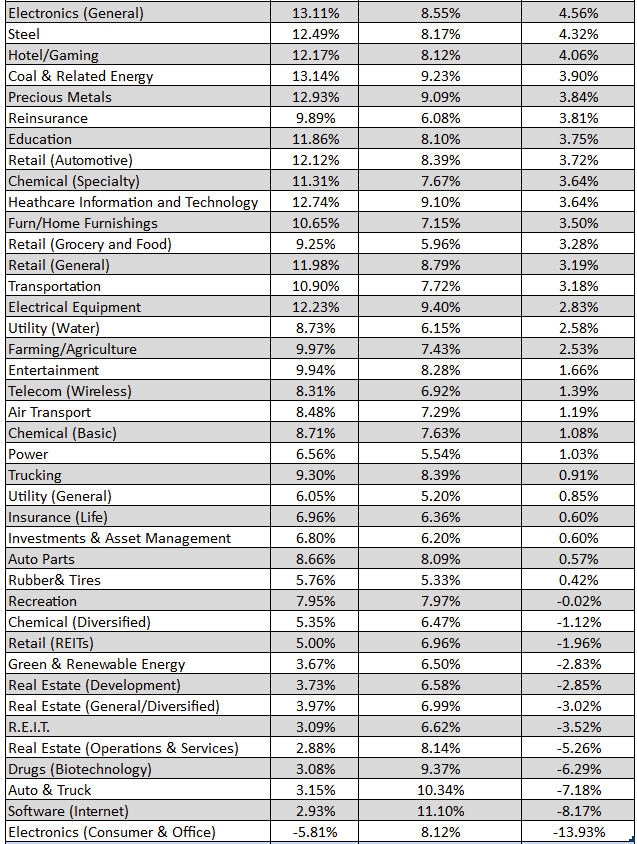
There are significant disparities across these sectoral groups. In 2024, at least half of them either burned more capital than they created, or failed to generate a sufficient net return to meet the hurdle rate of intelligent investors. The average net return for the market as a whole stood at just 1.1%.
The table has been broken out into three pools, and it appears that the top pool is the one in which we ought to be fishing.
Tobacco ranks as the highest-performing industry—a finding that aligns with the results of the Bessembinder study, which identified Altria as the company that has generated the most shareholder wealth over the past century. From 1926 to the study’s conclusion, Altria achieved a staggering lifetime buy-and-hold return of 244,300,000%, compounding invested capital at a remarkable 17.65% CAGR over 90 years.
Don’t mention this to the ESG crowd or they’ll be terribly upset! On a serious note, it does demonstrate that there is a clear tension between optimizing investment returns and pursuing ideological objectives.
Towards the bottom of the table is Air Transport. This industry has improved our lives by enabling us to complete a journey in hours which would previously have taken days or even weeks. Yet despite its transformational impact, it consistently burns more capital than it creates. The airline sector's ROIC has remained below the weighted average cost of capital (WACC) for almost the entirety of its existence, see the chart below:

Why do airlines collectively struggle to generate positive returns? The answer lies in the unfavorable industry dynamics:
Low Barriers to Entry: Thousands of airlines compete primarily on price.
State-Owned Competitors: Many national flag carriers operate under government subsidies, making competition difficult.
Supplier Power: Airbus and Boeing dominate aircraft manufacturing, limiting airlines' negotiating leverage.
Uncontrollable Costs: Fuel prices fluctuate based on the oil market, while labor costs are largely dictated by unions.
Lack of Customer Loyalty: Air travel is a commoditized service, with passengers primarily choosing based on price.
Economic Sensitivity: Unlike food or essential services, airline travel is discretionary and highly sensitive to economic downturns.
These factors ensure that airlines remain a structurally poor investment choice, highlighting the importance of industry selection when allocating capital.
“The great lesson in microeconomics is to discriminate between when technology is going to help you and when it’s going to kill you. And most people do not get this straight in their heads…. There are all kinds of wonderful new inventions that give you nothing as owners except the opportunity to spend a lot more money in a business that’s still going to be lousy. The money still won’t come to you. All of the advantages from great improvements are going to flow through to the customers.”
Charlie Munger
Is There A Geographic Read-Across?
Unsurprisingly, geographic analysis shows that no region escapes the phenomenon of having good and bad industrial sectors from an investment perspective.
“Notably, only about 29% of global firms earn a return on capital that exceeds their cost of capital, a trend that has remained unchanged for decades.”
Aswath Damodaran
But this analysis does have some interesting implications for market choices for investment purposes. The table below presents the industry group weightings in the market index for each region (excluding financials for consistency).
A key observation is that the S&P 500 is heavily weighted toward tech firms, which make up approximately 30% of the index. This stands in stark contrast to other developed economies, such as Europe, where tech represents less than 8%. Meanwhile, Europe and Japan tend to be more industrials-focused. These structural differences may help explain the S&P 500’s relative outperformance compared to other global indices in recent years.
")

Conclusion
Warren Buffett has often said that prior to investing in a company, he not only performs due diligence on that business, but he also deep dives on all of the key players in that industry. Only then does it become possible to fully understand all of the challenges and opportunities faced by that group of companies.
Buffett has also focused on specific industrial groups. Think about Coca-Cola, Gillette, American Express, Apple, Geico. These companies all feature in the sectors that perform the best. This is no coincidence.
So whether we think about Buffett, Terry Smith or Anthony Deden, it becomes clear that sectors and industries are front and centre of their minds when making investment decisions.
Since most industrial sectors are poor performers, this analysis suggests that there are lots of investment opportunities that can be filtered out of contention entirely based solely on the sector to which they belong. So the next time you hear a stock pitch, perhaps this ought to be your first filter.
By leveraging insights from rigorous industry analyses, investors can refine their approach and identify opportunities that truly create value over the long term.
As public market equity investors we enjoy the luxury of being able to reallocate our capital relatively easily, so why would we put our capital to work in a sub-optimal sector when we could deploy it more effectively elsewhere?

ROIC histories of ~7,000 public listed non-financial US companies from 1963 to 2003, each with revenues of more than $200m in 2003 dollars, adjusted for inflation. It includes both active companies as well as those that were acquired or dissolved. The revenues of the companies studied accounted for 99% of those of all non-financial US publicly traded companies.
Returns represent total annual returns (reinvestment of all distributions) and does not include fees and expenses.
For a better understanding of the flaws in index weightings, see: https://rockandturner.substack.com/p/is-the-stock-market-broken
Professor Aswath Damodaran’s source data
It would be very helpful to see the ROIC vs WACC table for a 5- or 10-year period, to smooth out any abnormal results in a single year.