


Alternative Investing - Part 1 of 3
Investing in a Time of Economic Fragility - Private better than Public Markets?


DISCLAIMER & DISCLOSURE: Of the companies featured, the author only holds a position in Brookfield Corporation at the date of publication, but that may change. The views expressed are those of the author and may change without notice. The author has no duty or obligation to update this information. Some content is sourced from third parties believed to be reliable, but accuracy is not guaranteed. Forward-looking statements involve assumptions, risks, and uncertainties, meaning actual outcomes may differ from those envisaged in this analysis. Past performance is not indicative of future results. All investments carry risk, including financial loss. This analysis is for educational purposes only and does not constitute investment advice or recommendations of any kind. Conduct your own research and seek professional advice before investing.
Part 1 in a 3-part series - Alternative Asset Management investments
Investing in Times of Turbulent Markets
Markets are turbulent. Geo-political risk is rising. Traditional investing models are creaking under the pressure of uncertainty. In this kind of environment, where do you put your capital to work?
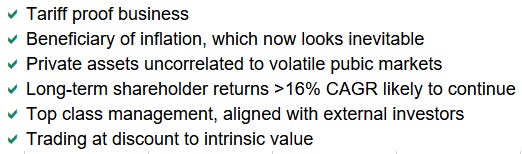
Investment choice today is more important than ever and the attributes I was looking for were:
For savvy investors, the answer is increasingly clear: alternative asset managers. These are best categorized as institutions focused on financial assets that do not fall into one of the conventional investment categories of publicly traded shares, bonds or cash instruments.
Today alternative investment firms are attracting huge volumes of capital and building portfolios of core long-term assets. These firms have outperformed the market for over a decade. Some were up more than 6,500% since the Global Financial Crisis (GFC). Yet, despite long-term success, their stocks are down up to 35% year-to-date, opening up what could be an attractive entry point.
Let’s explore why.
What Makes Alternatives So Attractive?
Alternative investments include private equity, infrastructure, credit, real estate, hedge funds, and tangible assets. Diversification is aimed at generating consistent returns across economic cycles.
In uncertain markets with rising inflation and stretched valuations in public equities, investors are looking for assets that offer better yields, real protection against inflation, and lower correlation to traditional markets.
In the current economic environment, which appears to be inflationary, real assets may well be the best place to invest - not only are they inflation proof, but the income stream from the asset revises upwards against a fixed purchase price, meaning that margins expand and growth compounds.
Leading names like Blackstone, Apollo, Brookfield, and KKR are at the forefront of this trend. They offer diversified strategies across asset classes, long-dated capital, and access to real assets that thrive in inflationary environments.
Modern private equity is not what it used to be. Forget the image of leveraged buyouts and asset stripping, or the early stage venture capital firms. These were high risk, but potentially high reward opportunities, which were both unsuitable and unattractive for investors. It explains why they saw the public equity and fixed income markets as safer homes for their money.
That has all changed now. Today’s alternative managers are offering exposure to low risk, high reward private market opportunities by building long-term portfolios in infrastructure, credit, and more. They have flipped the investment proposition on its head.
That’s why capital is flowing their way - fast.
Here’s why it works:
Real assets generate predictable, inflation-linked cash flows
Permanent capital reduces liquidity pressure
Public listings make them accessible to all investors
A Shift in Global Capital Flows
Over much of the last decade institutional capital has chased yield outside of public markets. With interest rates low and equities expensive, private markets became the obvious solution.
Infrastructure, data centers, and energy are just a few areas demanding capital. In coming years it is estimated that mission critical infrastructure will require more than $100 trillion of capital in the U.S. alone.
But where will it come from?
Governments are over burdened with national debt which stands at eye-watering levels both in absolute terms and relative to GDP. This explains why the 2021 Infrastructure Investment and Jobs Act (IIJA), also known as the ‘Bipartisan Infrastructure Law’, encouraged private infrastructure investment through the use of tax exemptions and other incentives. These were designed to plug funding gaps.
But where does the money come from? Not from banks or insurers, and here’s why:
Banks: By tightening post-2008 banking regulation, policymakers helped to shift risk out of the banking system and make it safer. But they did so at the cost of liquidity in markets. Bank lending in the US is down to about 30% of the overall market as private credit has increasingly moved into this space and banks have de-risked their balance sheets. Banks are tending away from asset-backed financing due to tougher capital requirements. Also, their operating model is one of borrowing short and lending long to generate a net interest margin. It requires the management of duration risk, yet they are poorly equipped for complex infrastructure lending. Banks don’t warehouse risk and, given the unreliability of the customer deposits which they rely upon for their capital base, combined with this risk not being well suited to securitization, how could they manage it?
Insurers: The insurance sector is concerned with liability matching returns from regular income streams rather than achieving exceptional total returns on investment. They are risk averse and have historically preferred government debt and investment grade credit which results in a stable yield. Additionally, infrastructure projects often rely on the outcome rather than the income of the project to repay the debt, so they cannot be credit rated. For instance, while a pipeline is being built, there is no cash flow or performance history to rate. Consequently, insurers are not in a position to finance these projects.
Historically this resulted in a severe lack of funding for very viable long-term investments, while a pool of capital was being put to work in a sub-optimal manner (insurers hold over $8 trillion in investible capital with over 60% of their investments in the form of relatively low yielding bonds!)
Alternative asset managers recognized this opportunity and stepped in to provide a solution. By acquiring an insurer they are turbo-charging their growth by incorporating insurance into their playbook - Berkshire Hathaway style - which improves risk-based returns.
They now have both permanent long-term capital required to finance these mission critical infrastructure deals, plus they have the structure, through their insurance subsidiaries, to borrow long and lend long, thereby eliminating any duration risk.
This has enabled the alternative asset managers to build vertically integrated platforms which raise capital, underwrite risk, and structure bespoke solutions - all under one roof. They also have credit divisions specializing in debt, asset management looking after client capital and other specialist vehicles managing specific asset types (real-estate, energy, data centers, etc.)
Collectively, this creates a powerful flywheel: invest on favourable terms → generate excellent returns → attract more capital which fuels more deals → grow and generate still greater returns. This creates a compounding growth engine.
The chart below shows how the US financial services sector has grown over the past decade from a market cap of $2.3 trillion in 2014 to about $3.4 trillion today. More particularly, alternative asset managers are now ~12% of that number, up from ~4% ten years earlier.

A Retirement Crisis in the Making or Fuel for Alternatives?
The insurance angle is interesting. Unlike Buffett’s insurance businesses, alternative asset managers are interested in accessing long-term capital rather than annual premiums. As such, they are very much focused on pension funds and life assurance.
Regulatory changes have paved the way for private equity investments in 401(k) plans, so private equity firms are actively seeking access to the vast pool of capital held in these plans, which collectively manage over $7 trillion in assets. There is growing interest among plan holders in these alternative investments, with allocations rising from 13% in 2022 to 15% in 2023, a trend that looks sure to continue.
Investors are acutely aware that almost half of their passively invested money is flowing into 10 public companies due to S&P500 market cap weightings. That’s a huge concentration risk for U.S. citizens saving for retirement, particularly when valuations have been stretched in recent years.

Alternative managers offer a solution: high-quality private market opportunities with far better risk-adjusted returns. This explains why, over time, more of this retirement capital is being reallocated into alternatives, fueling the boom in this sector.
According to iCapital, an industry research platform, total AUM in the industry are expected to hit $25 trillion by 2028 from its current level of ~$18 trillion.
Are The Best Investment Opportunities Private?
From 2014 to 2024, private market Assets under Management (AUM) tripled.
Concurrently, an increasing number of public companies are now being taken private. Not long ago there were ~7,000 public companies in the US, now there are closer to ~4,000.
Why?
Over the past 20 years, passive investing has become so popular that it is now the dominant form. Yet there are an increasing number of companies excluded from indices and so are ignored by passive investors. As a result, they often trade at valuations well below their true intrinsic value, creating both an opportunity and an incentive to take them private.
“There are a group of companies that do not fit neatly into indexes and as a result, trade poorly relative to value. Our recent take privates such as Triton, Tritax EuroBox and Network International are all examples of companies that were excluded from indexes and therefore, were acquired at good value.”
Bruce Flatt, CEO, Brookfield
Not only are public companies being taken private, but far fewer companies are listing in public markets.
Between 2002 and 2019, late-stage private investments skyrocketed from $14.2 billion to $80 billion. The increase in availability of private equity causes companies to delay their IPOs:
In 1980, the median age of a company at IPO was just 6 years.
By 2021, that number had jumped to 11 years - and for tech companies, it’s now over 12 years.
There are a host of reasons for these delays, but among them is passive investing once again. Market cap weighted indices cause a disproportionately large amount of passive public capital to flow to the top of the stack, meaning that there is too little at the bottom which is where most newly listed companies enter the market.

Alternative asset managers are capitalizing on this opportunity by cherry picking the best businesses and providing the capital that they need.
This means that some of the best investment opportunities are unavailable for public market investors - unless, that is, they are accessed indirectly via a shareholding in an investment asset manager.
You Can Now Buy the Managers Themselves
Many of the leading alternative investment firms are listed on public markets, meaning that they are more accessible to a broader base of investors than the private equity funds of yesteryear.
They offer a unique opportunity to invest in the providers of capital, not just the users of it.
To provide an idea of scale, the leading alternative asset managers have hundreds of billions of dollars in AUM, and some have already crossed the trillion dollar threshold. These are enormous, investment grade institutions.
For the very largest and often most attractive deals, all investment grade, there are only a tiny number of alternative asset managers with the scale to look at them, which means that competition is limited and great deals are relatively easy to win.
No two alternative asset managers is the same. For instance:
Blackstone Group (BX) - One of the largest alternative investment firms globally, with significant holdings in private equity, real estate, credit, and hedge funds.
KKR & Co. Inc. (KKR) - A global investment firm that manages multiple alternative asset classes, including private equity, energy, infrastructure, real estate, and credit.
The Carlyle Group (CG) - A leading global investment firm with expertise in private equity, credit, and real estate.
Apollo Global Management (APO) - Specializes in private equity, credit, and real estate investments.
Ares Management Corporation (ARES) - Focuses on credit, private equity, and real estate investments.
Brookfield Asset Management (BAM) - Manages a diverse portfolio of assets, including real estate, infrastructure, renewable power, and private equity. Now part of the same group as Oaktree Capital (Howard Marks).
TPG Inc. (TPG) - A global alternative asset firm with investments in private equity, growth equity, real estate, and public equity.
Each has built massive platforms capable of capitalizing on market dislocations and inefficiencies.
This series of posts will focus on the following four:

Evaluating These Businesses
These firms generate income through:
Fee Related Earnings (FRE): Recurring revenue from managing assets1
Carried Interest: Performance-based share of investment profits2
While FRE is predictable and steady, Carried Interest is more volatile and realized only on the disposal of the asset when profits are crystalized and distributed. As such, FRE is visible in earnings numbers whereas Carried Interest is often not visible as an accrual, only upon crystallization which may be a considerable time later.
Both of these are non-GAAP measures, and so will not feature in statutory accounts.
This situation makes the official financial reports, published quarterly or annually, entirely unreliable.
To make matters more complicated, the approach to calculating FRE and Carried Interest is not standardized across the asset management industry. While there are common practices and frameworks, individual firms often tailor their methodologies based on their specific business models, investment strategies, and regulatory environments.
Some firms may adhere to IFRS accounting standards, while others use US GAAP, both of which have very different approaches to asset valuation and depreciation. Some may recognize unrealized Carried Interest, which flatters its numbers, while others adopt a more prudent approach, recognizing Carried Interest only when it is realized. All of this makes a side-by-side comparison inherently difficult.
To complicate matters further, some acquired assets are intended to be be perpetual holdings, while others are acquired with the intent to improve and monetize them as part of its capital recycling programs. For perpetual assets, Carried Interest doesn’t factor into short- or medium-term numbers, which is why some firms revalue their balance sheet regularly which means that enhancements in valuation appear in the shareholder equity numbers.
“In an industry where net asset value per share is arguably the most important metric, IFRS accounting enables a company such as ours to show our shareholders both cash flows and wealth created in a more transparent fashion.”
Bruce Flatt, Brookfield
Accounting rules now require firms to report fair value changes as unrealized revenue and profit which result in wild swings in consolidated accounts from one period to the next. Berkshire Hathaway has a similar problem and Warren Buffett has often urged investors to ignore such reported gains and losses as meaningless. Nonetheless, they create noise and confuse many investors, which can impact valuations.
Because of the complex accounting around investments, traditional financial accounts and earnings metrics often fail to reflect the real picture. Numbers need to be restated to remove this noise and to arrive a more reliable metric to measure the performance of these businesses.
Distributable Earnings (DE) is the name given to a metric commonly used by the alternative asset managers. It represents earnings received by the company that are available for distribution to common shareholders or to be reinvested into the business and it differs significantly from statutory net income numbers.
How Does This Business Model Actually Work?
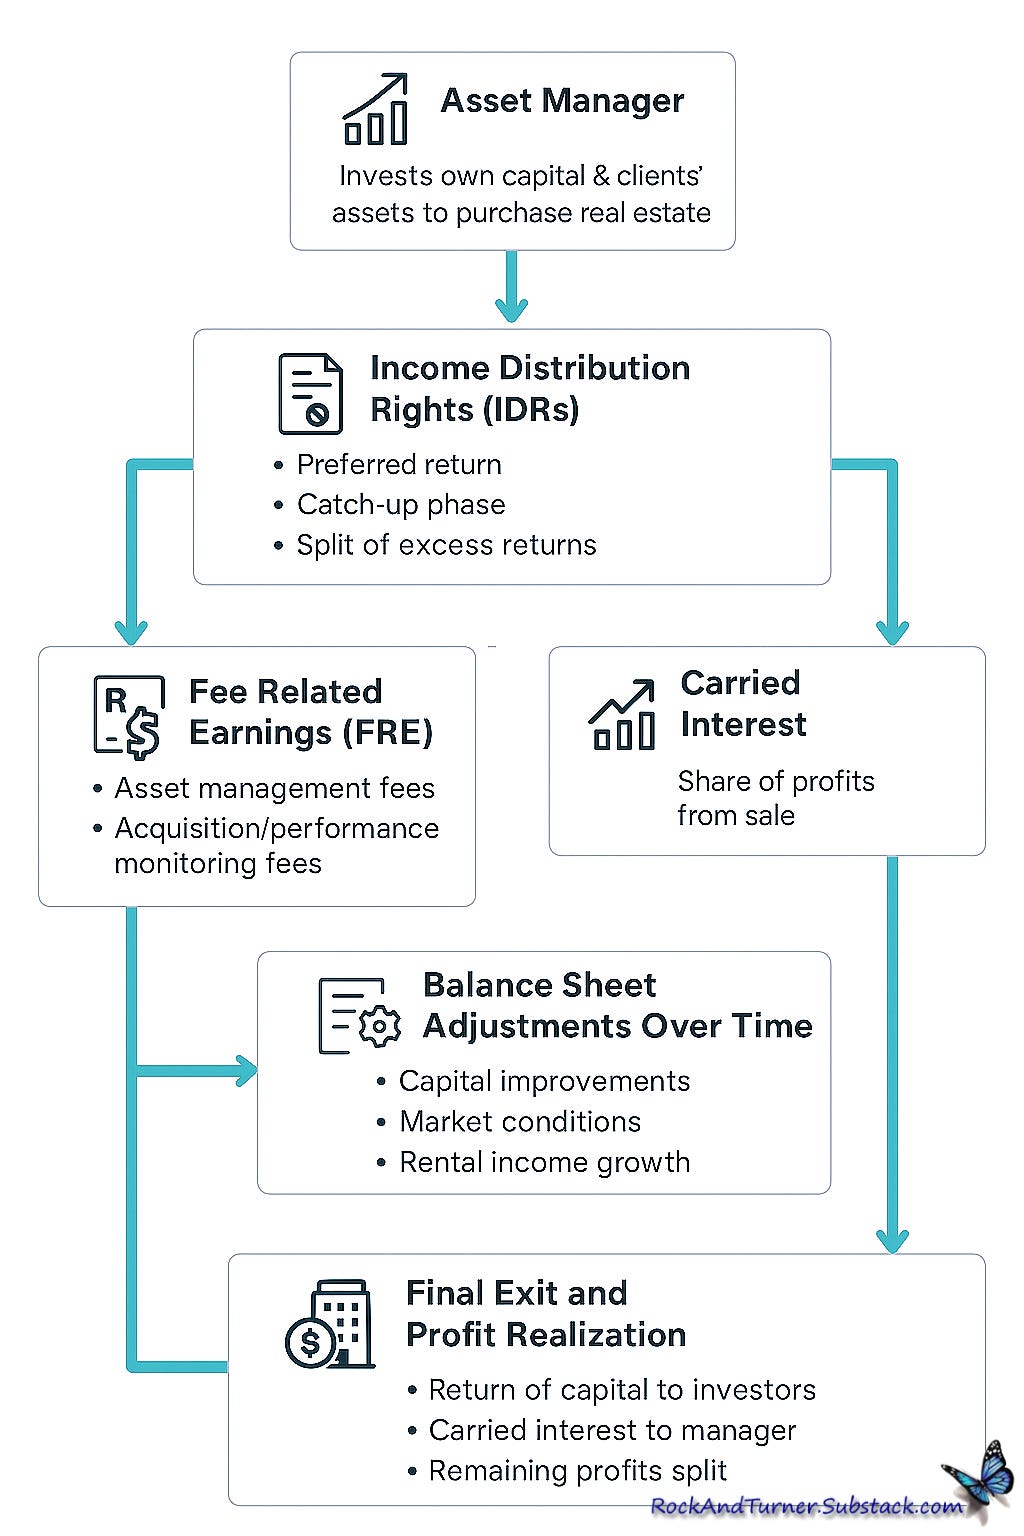
Imagine an asset management company that invests in real estate. But unlike a traditional manager that only invests other people’s money, this firm also puts some of its own capital into the mix.
So, the company raises money from clients (its Assets Under Management, or AUM), adds its own investment, and acquires a property.
But here’s where it gets interesting - the firm doesn’t just collect rent and wait for the property to appreciate. It actively improves the asset - renovating, upgrading, repositioning - so the value grows faster than it would otherwise.
To make sure everyone’s interests are aligned, the manager and investors agree on a contractual framework - usually in the form of Income Distribution Rights (IDRs).
Here’s a common setup:
Income Sharing
The regular rental income is divided between the manager and the investors, based on how much each contributed. Everyone gets their fair share of the cash flow and the asset manager earns management fees (FRE).
Capital Gains (Waterfall Structure)
When the property is eventually sold, profits are distributed through a waterfall:
Return of Capital
Everyone gets back their original investment first.Preferred Return
External investors may be promised a return (e.g., 8% annually) before any profits are split.Catch-Up Provision
Once the preferred return is met, the manager gets a bigger cut (the “catch-up”) until it receives its agreed portion of the profits.Profit Split (Carried Interest)
This is where the real upside kicks in. Any residual profits are split, often favouring the asset manager with a performance-based allocation (e.g., 20% carried interest on all excess profits).
This model creates strong alignment between the asset manager and its clients.
The manager earns a steady income - but also shares in the long-term upside.
In short, it balances predictability with performance incentives - a structure that’s well-designed to drive both short-term sustainability and long-term value creation.
Timing May Be on Your Side
The years 2022 and 2023 were tough for capital deployment. But 2024 has seen a strong rebound. Blackstone alone invested $134 billion in the year. That activity should begin to show up in future returns.
At the same time, the recent dip in share prices may have presented a very interesting entry opportunity.
Focus on Four
This series of posts will focus on the following four alternative asset managers:
Blackstone (market cap $145 billion)
Brookfield (market cap $72 billion)
KKR (market cap $87 billion)
Apollo (market cap $63 billion)
Let’s start by exploring how they stack up in terms of share price performance over various time frames:
CHART 1: Since the great financial crisis, ~15 years, KKR has performed the best, closely followed by Blackstone with Brookfield and Apollo trailing behind but still showing a robust performance increasing in value by more than 7x.

CHART 2: Over the past 10 years Apollo has catapulted to the top of the performance table.

CHART 3: Shortening the time period further, over the past 5 years KKR reclaims the top spot. with Apollo and Blackstone tracking each other.

CHART 4: Over the past two years, the story remains very much the same:

CHART 5 (below): However, year to date, we have witnessed a stock market sell off.

Why the Sell-Off in Alternative Asset Managers?
The sell off can be traced back to the new U.S. administration - and two key triggers:
The Trump administration is considering fiscal reforms that would increase taxes on carried interest - essentially, the profits U.S. investment firms earn when deals go well. The Congressional Budget Office estimates this change could bring in $13 billion over the next decade. On 7th February 2025 when the news broke, KKR lost 11% of its market cap, Apollo fell 4.4% and Blackstone 3.9%.
Meanwhile, tariffs have been rattling global trade, casting a shadow of uncertainty over valuations and shaking investor confidence.
While the three big U.S. players - KKR, Apollo, and Blackstone - all suffered share price drops of around 27–32%, Brookfield stood out. It declined just 14%.
That’s a meaningful difference. Why did Brookfield hold up better?
Let’s dig in.
First off, we’re not comparing apples to apples.
The stock we’re looking at is Brookfield Corporation (BN) - the holding company - not Brookfield Asset Management (BAM), its asset management arm.
Brookfield is a hybrid. It manages assets, sure - but it also owns and operates them directly. These include infrastructure (utilities, pipelines, data centers), real estate (office buildings, retail), renewable power and private equity operations.
Unlike the others, which primarily raise and manage third-party capital for fees, Brookfield also puts its own capital to work. That means its revenues come not just from management fees, but also from the operations of real-world assets.
The trade-off? Brookfield’s DE (Distributable Earnings) margins look lower. But that’s just optics - because more of its income is generated from actual operations, not just fee collection.
Brookfield’s CEO, Bruce Flatt, has long emphasized playing the long game: prioritizing multi-decade returns over quarterly results. It’s a strategic choice that focuses on durability and resilience over short-term performance.
There are other key differences too:
Brookfield uses less aggressive stock-based compensation.
It’s the only one in the group that’s actually reduced its share count in recent years.
All this makes one thing clear: Brookfield Corporation is the orange in a basket of apples.
Times They Are A Changing
You’ve heard it before: ‘Past performance is no guarantee of future returns.’
Perhaps we should ignore the charts above and, instead of investing by looking in the rear view mirror, look at the road ahead.
In addition to fiscal reforms being considered by the Trump administration mentioned above, monetary policy has also shifted in recent years.
Private assets under management (AUM) have experienced explosive growth over the past decade, increasing from $3.8 trillion in 2014 to $13.1 trillion a decade later. This was a period of historically low interest rates and expanding deal volumes combined with a globalized economy.
Macroeconomic conditions over the next decade will be quite different.
KKR is, at its heart, a private equity firm with Leveraged Buy-Outs (LBO) as its primary modus operandi. Rather than using cash to acquire companies, much of the cost of the acquisition is debt financed with the burden being transferred to the balance sheet of the acquired company rather than being assumed by KKR. The model is great when it works as it provides leveraged returns for KKR without it needing to finance the leverage.
The model works like this:
KKR buys a company using mostly debt.
That debt gets dumped on the acquired company’s balance sheet—not KKR’s.
In a low-rate environment, that was fine. Debt was cheap.
But those days are gone.
Many LBOs used floating-rate debt, which has now become 4x more expensive. As refinancing looms, some deals might not be viable anymore. Cash flows that once covered interest payments now might fall short.
The success that firms like KKR enjoyed during the ZIRP (Zero Interest Rate Policy) era will be hard to replicate in the current climate. Higher rates and lower equity valuations led to a decline in fundraising, deployment, and harvesting activity during 2022-23 and the same may apply in 2025 due to the economic policies of President Trump.
The firm's global investments make it more vulnerable to trade disruptions, particularly in Asia and Europe. KKR is actively working to mitigate trade vulnerabilities in its portfolio.
A similar pattern is emerging for Blackstone and Apollo, albeit to a lesser extent.
Blackstone benefits from higher rates due to its exposure to floating-rate investments, which increase net income. However, the firm is cautious about the impact of further rate hikes on portfolio company performance and asset valuations. Management notes that while tariffs pose risks, the firm has limited exposure to businesses that export physical goods, reducing direct impact.
Apollo likely faces similar challenges to its peers, including pressure on valuations and fundraising. Its diversified strategies across private equity, credit, and real estate may help navigate the environment.
This raises the question of whether the valuations of these three U.S. asset managers had run too far ahead of intrinsic value. The recent corrections suggest that this may have been the case.
In contrast, Brookfield, which has an entirely different business model to the other three, uses far less leverage and so is arguably better placed to prosper in a higher rate environment. Although higher rates negatively impact real estate valuations, since Brookfield likes to apply permanent capital to its asset base, this could present favourable opportunities for new investments. It is also not reliant on equity market valuations for harvesting returns. Best of all, it appears to have a share price that is more closely aligned with its underlying unit economics. If anything, it might even be undervalued.
The latest full-year Distributable Earnings (DE) or Net Adjusted Income figures for the year ended December 31, 2024 were:
Brookfield Corporation: $6.3 billion on a market cap $72 billion = 11.4x
Blackstone: $6.0 billion on a market cap $145 billion = 24.2x
KKR: ~$3.1 billion on a market cap $87 billion = 28.1x
Apollo Global Management: $4.8 billion on a market cap $63 billion = 13.1x
Judging by Chart 5 above, the market seems to recognize the difference.
Perhaps the big winners of the last decade were fueled by multiple expansion and so will not be the best performers over the next ten years.
What About Regulation Risk?
Some worry that alternative asset managers could come under heavier regulatory scrutiny.
But that seems unlikely.
Here’s why: Banks operate with 12x to 14x leverage. That’s why they can pose systemic risks when a credit crisis strikes, as we saw during the GFC.
Alternative asset managers, by contrast, reduce systemic risk by shifting leverage away from the banking system. Every dollar of risk they take is one less for the banks.
In fact, regulators should welcome this trend - not fight it.
And since many of these firms fund critical infrastructure (think energy, transit, data networks), they play a vital role in economic growth.
Governments would do well to support their activity, not restrict it.
Final Thought
The rise of alternative asset managers represents a fundamental shift in global capital allocation. These firms are not just taking market share from traditional banks and insurers - they are creating a paradigm shift in the world of finance that should not be ignored.
These firms are reshaping finance as we know it. For long-term investors seeking:
Diversification
Inflation protection
Access to high-quality private markets
…this could be one of the most compelling spaces to watch.
Here are the links for Part 2 and Part 3, where we’ll take a closer look at each of the four firms and what makes them tick.

Fee Related Earnings (FRE) - these are the main source of income for alternative asset managers. Management fees are derived from long-term locked-up capital and result in earnings streams that tend to be largely insulated from wider market movements. Contractual IDRs (income distribution rights) outline how income or returns generated by an investment are distributed among stakeholders (investors, fund managers, or other parties involved). To further complicate matters, IDRs often include performance-based incentives like carried interest.
Carried Interest - A performance fee achieved on returns over a prescribed threshold. Carried interest is best defined as a percentage of the excess profits generated by a fund, after investors have received their initial capital and a preferred return. These are lumpy and less predictable in nature as they only crystalize at certain points in time, usually when a fund reaches maturity.


Great read
This is wonderful. Thank you for sharing.